

PainCube
 Turning pain into measurable data for earlier clinical decisions.
StellarCube is developing PainCube, a clinical decision support solution that uses multimodal biosignals and AI to quantify and predict pain.
Joint research withJohns Hopkins Medicine · Korea University Anam Hospital
PainCube is at the stage of developing and validating its algorithms on biosignal and medical-record data collected with its research partners.
SOLUTION
PainCube solution in detail
- 01
Quantifying pain and predicting it ahead of time
Unlike assessment that rests on what a patient can describe, PainCube analyses biosignals in real time to quantify pain, with the goal of predicting it 30–60 minutes before onset.
BiosignalsPain index, early prediction
- 02
Integrated analysis of multiple biosignals
Integrates electrocardiography (ECG), photoplethysmography (PPG), oxygen saturation (SpO₂), respiratory rate, heart rate and body temperature to keep watching for pain even in patients who are unconscious or unable to communicate.
Multiple biosignalsContinuous observation
- 03
From reactive to preventive care
PainCube moves pain management away from responding after pain has set in, toward predicting pain and caring for it in advance.
Pain predictionPreventive pain care
WHY PAINCUBE
Pain has been left unmeasured
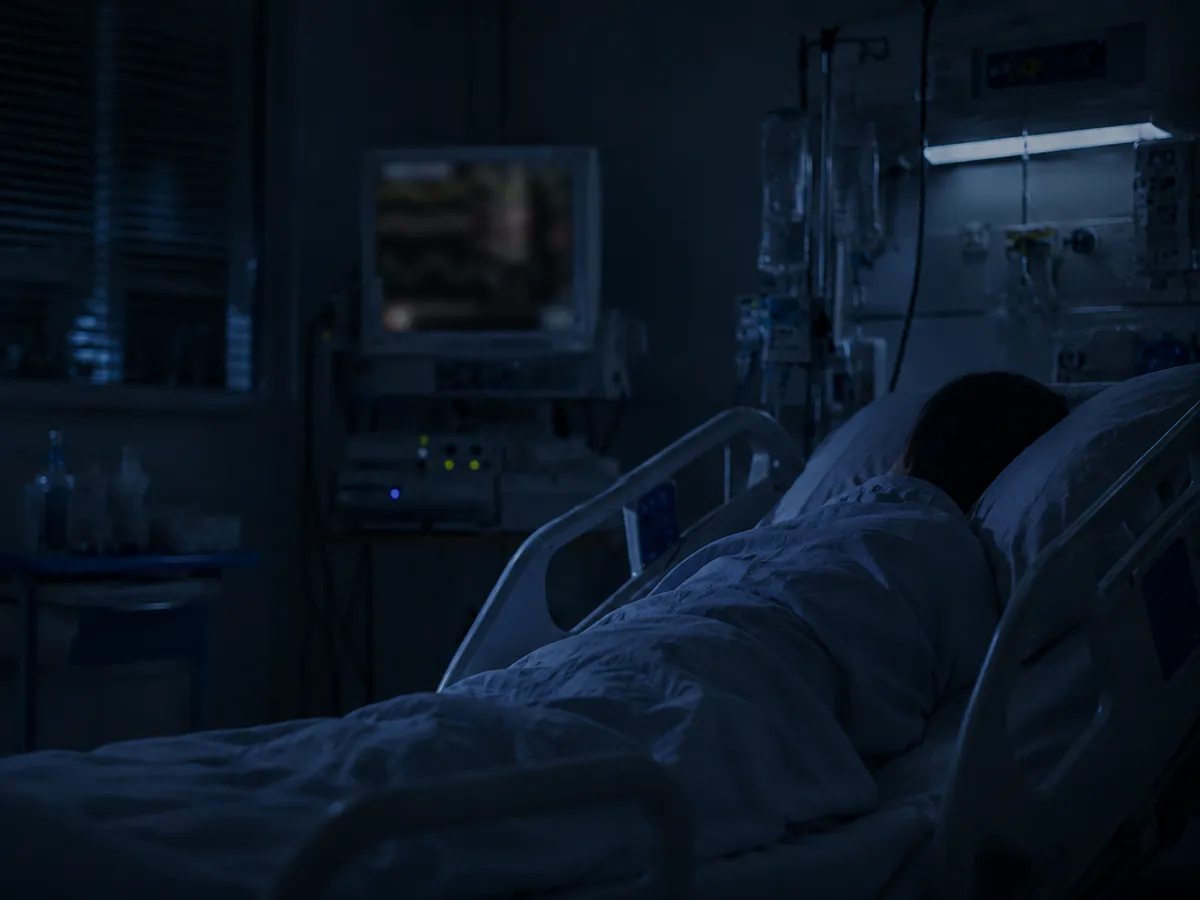
Intensive care still has no objective way to measure pain, and no precise standard for when and how much analgesic to give.
- No objective way to measure pain, and no precise standard for analgesic dosing
- Pain measured from the patient's own subjective report, against imprecise criteria
- Analgesics prescribed on clinical intuition
Postoperative pain not adequately managed
80%
Source · Gan, J Pain Res 2017
HOW IT WORKS
How PainCube works
Biosignals are gathered, noise is stripped out, pain is quantified and predicted, and the result reaches the care team. The four stages below carry the same numbers as the sections that follow.
PainCube runs on two AI models. DDCAE uses an encoder–decoder structure to detect and remove noise that can be mistaken for pain, such as ECMO operation or body movement, and TCAtt-PainNet learns biosignal patterns preceding pain onset and pain-reduction patterns after analgesic administration to quantify and predict pain.
01. Sensor
A sensor worn where each patient allows — chest, upper arm or wrist
02. DDCAE
Removal of intensive care noise
03. TCAtt-PainNet
Pain anticipated from biosignal and pain patterns
04. CDSS
Dashboard-based pain alerts and administration support
SENSOR + DATA
Multimodal biosignals and clinical data
PainCube collects six or more biosignals — electrocardiography (ECG), photoplethysmography (PPG), oxygen saturation (SpO₂), respiratory rate, heart rate and body temperature — together with six or more types of medical-record data, including age and sex, diagnosis, surgical history, pain scores (NRS), medication and analgesic administration records.
Biosignal data
- Electrocardiography (ECG)
- Photoplethysmography (PPG)
- Oxygen saturation (SpO₂)
- Respiratory rate
- Heart rate
- Body temperature
Medical record data
- Age and sex
- Diagnosis
- Surgical history
- Pain scores (NRS)
- Medication
- Analgesic administration records
mV
a.u.
a.u.
Also measured
Wearing position
- 1Chest patch
- 2Upper-arm patch
- 3Wrist band
SIGNAL DENOISING AI
DDCAE
Extracting the pure pain signal with a noise-removal AI algorithm
- Encoder–decoder based, using how regular pain is against how irregular noise is
- Detects and removes noise mistaken for pain, such as ECMO operation and body movement
- Extracting the pure pain signal resolves the false-alarm problem
mV
Powerline interference
a.u.
Motion artifact
a.u.
Baseline drift
mV
a.u.
a.u.
Noise in the raw signal
- Powerline interference
- High-frequency noise
- Motion artifact
- Baseline drift
PAIN QUANTIFICATION & PREDICTION AI
TCAtt-PainNet
Pain quantification, and prediction 30–60 minutes before onset
- Learns biosignal patterns preceding pain onset, and pain-reduction patterns after analgesic administration
- PainCube expresses the result of its biosignal analysis as a pain index (CPI) on a 0–10 scale.
- PainCube analyzes biosignals in real time to quantify pain, and is being developed with the goal of predicting pain 30–60 minutes before onset.
- Secures the golden hour for prescribing and administering analgesics
- 1.8
- 7.4
- Observed
- Forecast
- Alert level
CDSS
Clinical decision support system
Data-grounded pain management and analgesic administration through monitoring and decision support
Jiwoo HanF / 62Fictional patient
Bed12
ProcedureLaparoscopic colectomy
CoursePOD 1
Bed list
Pain increase predicted
7.4/ 10
Current pain index 1.8
A rising pain pattern appears in the denoised biosignals. This patient cannot self-report pain.
91%
Basis
- Heart-rate variability pattern
- Falling pulse amplitude
- Rising respiratory rate
Pain index trend
No intervention
-30 minNow+30 min
- High
- Consider preemptive IV analgesia
Try it — the screen shows what approval changes.
Vitals
Recent events
- 09:41Pain increase alert raised
- 09:32Rising pain index observed
- 09:18Denoising applied
- 09:05Monitoring started
Alerts 30–60 minutes before pain onset
Secures the golden hour to respond to pain
Data-grounded support for analgesic decisions
Including the type and timing of administration
Real-time patient monitoring dashboard
Pain management tailored to each patient
CLINICAL IMPACT
Streamlining the whole pain-management process
Published figures put pain management at 34 minutes per patient per 12-hour shift (SCCM PADIS 2018; Gelinas et al, 2006). By streamlining routine rounds, pain assessment and administration, PainCube is estimated to reduce this to about 7 minutes — roughly 80% less.
34min
Before
7min
After
80%lessEstimate
- Conditions
- per 12-hour shift · per patient
- Baseline source
- SCCM PADIS 2018 · Gelinas et al, 2006
JOINT RESEARCH
Joint research
PainCube is being developed through joint research with Johns Hopkins Medicine and Korea University Anam Hospital.
Data collection covers 32 beds at Johns Hopkins Medicine and 24 beds at Korea University Anam Hospital, spanning more than 12 types of biosignal and medical-record data.

Johns Hopkins Medicine
Data collection32 beds

Korea University Anam Hospital
Data collection24 beds